Exercise 6: Identifying Vulnerability Discovery
Estimated Time to Complete: 15 minutes
Objectives
- Locate API access log data in CloudWatch
- Use CloudWatch Logs Insights to identify possible fuzzing from suspect IP
- Dig deeper into API logs to find some of the attack payloads attempted (that ultimately failed)
Challenges
Challenge 1: Locate API Access Log Data
As you saw in the last exercise, the suspect IP address was communicating with the /api/ quite a lot in a short amount of time. When visiting that endpoint, the client traffic is forwarded to an API Gateway resource. Find the appropriate log data related to API Gateway activity and determine its schema in AWS CloudWatch.
Solution
-
To view all log groups in AWS CloudWatch, you can use the following CLI command:
aws logs describe-log-groupsSample Results
{ "logGroups": [ { "logGroupName": "/aws/api_gw/evidence_api", "creationTime": 1658146688502, "retentionInDays": 1, "metricFilterCount": 0, "arn": "arn:aws:logs:us-east-1: 012345678910:log-group:/aws/api_gw/evidence_api:*", "storedBytes": 0 }, { "logGroupName": "/aws/lambda/evidence", "creationTime": 1658146708979, "retentionInDays": 1, "metricFilterCount": 0, "arn": "arn:aws:logs:us-east-1: 012345678910:log-group:/aws/lambda/evidence:*", "storedBytes": 0 }, { "logGroupName": "cloudtrail-vmjmgvts6lxfrf22", "creationTime": 1658146687965, "retentionInDays": 1, "metricFilterCount": 0, "arn": "arn:aws:logs:us-east-1: 012345678910:log-group:cloudtrail-vmjmgvts6lxfrf22:*", "storedBytes": 0 } ] } -
If you look closely at each line beginning with
logGroupName, one sticks out:/aws/api_gw/evidence_api. In fact, all log groups capturing API Gateway traffic data will begin with/aws/api_gw/. -
To determine the schema, we could of course look at AWS' documentation, but since this log data, as you will see, is in JSON format, the data more or less describes itself.
-
To view log entries, you must indicate which log stream (within the
/aws/api_gw/evidence_apilog group) the data resides in. You can list the available streams like so:aws logs describe-log-streams --log-group-name /aws/api_gw/evidence_apiSample Results
{ "logStreams": [ { "logStreamName": "log_stream_created_by_aws_to_validate_log_delivery_subscriptions", "creationTime": 1658146688901, "firstEventTimestamp": 1658146688912, "lastEventTimestamp": 1658146688912, "lastIngestionTime": 1658146688916, "uploadSequenceToken": "49039859511763443492676233544510674742969342109675099294", "arn": "arn:aws:logs:us-east-1: 012345678910:log-group:/aws/api_gw/evidence_api:log-stream:log_stream_created_by_aws_to_validate_log_delivery_subscriptions", "storedBytes": 0 }, { "logStreamName": "r0mx7qm4bi_api-2022-07-18-12-33", "creationTime": 1658147639106, "firstEventTimestamp": 1658147619982, "lastEventTimestamp": 1658147619982, "lastIngestionTime": 1658147639124, "uploadSequenceToken": "49039859511764706535751652337852435779136233393628453130", "arn": "arn:aws:logs:us-east-1: 012345678910:log-group:/aws/api_gw/evidence_api:log-stream:r0mx7qm4bi_api-2022-07-18-12-33", "storedBytes": 0 }, { "logStreamName": "r0mx7qm4bi_api-2022-07-18-12-34", "creationTime": 1658147666899, "firstEventTimestamp": 1658147641268, "lastEventTimestamp": 1658147671195, "lastIngestionTime": 1658147704482, "uploadSequenceToken": "49039859511764793411435000848384057422330731216904803152", "arn": "arn:aws:logs:us-east-1: 012345678910:log-group:/aws/api_gw/evidence_api:log-stream:r0mx7qm4bi_api-2022-07-18-12-34", "storedBytes": 0 } ] } -
To list a few log entries, you can run the following commands to extract the second available log stream name (the first is used by AWS to test delivery of the data to CloudWatch) and then get the events of that stream:
STREAM=$(aws logs describe-log-streams --log-group-name /aws/api_gw/evidence_api --query 'logStreams[1].logStreamName' --output text)
aws logs get-log-events --log-group-name /aws/api_gw/evidence_api --log-stream-name $STREAM
Sample Results
{ "events": [ { "timestamp": 1658147619982, "message": "{\"httpMethod\":\"GET\",\"integrationErrorMessage\":\"-\",\"protocol\":\"HTTP/1.1\",\"requestId\":\"Vdntpho8IAMEVSQ=\",\"requestTime\":\"18/Jul/2022:12:33:39 +0000\",\"resourcePath\":\"-\",\"responseLength\":\"607\",\"routeKey\":\"ANY /\",\"sourceIp\":\"107.21.85.89\",\"status\":\"200\"}", "ingestionTime": 1658147639124 }, { "timestamp": 1658147639029, "message": "{\"httpMethod\":\"GET\",\"integrationErrorMessage\":\"-\",\"protocol\":\"HTTP/1.1\",\"requestId\":\"VdnwojmSoAMEVHA=\",\"requestTime\":\"18/Jul/2022:12:33:59 +0000\",\"resourcePath\":\"-\",\"responseLength\":\"607\",\"routeKey\":\"ANY /\",\"sourceIp\":\"107.21.85.89\",\"status\":\"200\"}", "ingestionTime": 1658147667963 } ], "nextForwardToken": "f/36977927999530860644098179687600231948455474840454758400/s", "nextBackwardToken": "b/36977927574768566847685400675904898060423196092934324224/s" } -
The results are a little cryptic, but for each event, you can see there are
timestamp,message, andingestTimefields. However, it appears that there is some nested JSON data in themessagefield that we can do a better job to visualize usingjq.aws logs get-log-events --log-group-name /aws/api_gw/evidence_api --log-stream-name $STREAM | \ jq '.events[].message | fromjson'Sample Results
{ "httpMethod": "GET", "integrationErrorMessage": "-", "protocol": "HTTP/1.1", "requestId": "Vdntpho8IAMEVSQ=", "requestTime": "18/Jul/2022:12:33:39 +0000", "resourcePath": "-", "responseLength": "607", "routeKey": "ANY /", "sourceIp": "107.21.85.89", "status": "200" } { "httpMethod": "GET", "integrationErrorMessage": "-", "protocol": "HTTP/1.1", "requestId": "VdnwojmSoAMEVHA=", "requestTime": "18/Jul/2022:12:33:59 +0000", "resourcePath": "-", "responseLength": "607", "routeKey": "ANY /", "sourceIp": "107.21.85.89", "status": "200" } -
Now, you can see some nested fields:
httpMethod: The HTTP method used when requesting/api/integrationErrorMessage: If an error occured, what the message isprotocol: The HTTP protocol version the client usedrequestId: A unique identifier for each API Gateway interaction (we saw this during the attack when issuing theHEADrequest to/api/)requestTime: The time of the requestresponseLength: The amount of data, in bytes, returned to the clientrouteKey: The route configuration used by the API Gateway resourcesourceIp: The source IP addressstatus: The HTTP status
Challenge 2: Use CloudWatch Insights to Find Fuzzing Attempts
Armed with this new data and an understanding of its available fields, craft AWS CloudWatch Logs Insights queries to identify possible fuzzing of the application.
Solution
-
Let's begin by launching a really basic query which will be extended to identify the possible fuzzing by the suspect IP address. List all of the log entries by executing the following commands in your CloudShell session:
Note
Unlike using the AWS Management Console, these commands are in two parts: execution and retrieval. That is why you will see the first (very long) command execute the query and save the query ID. The query ID is needed in the second command to retrieve the results from the correct query.
There is also a little command-line Kung Fu to grab data from the previous three hours.
QUERY_ID=$(aws logs start-query --start-time $(date -d '-3 hours' "+%s") \
  --end-time $(date "+%s") \
  --query-string 'fields @timestamp, @message' \
  --log-group-name /aws/api_gw/evidence_api \
  --query 'queryId' --output text)
aws logs get-query-results --query-id $QUERY_ID
Warning
If you see a message similar to the below message, that means the query is not finished.
{
    "results": [],
    "statistics": {
        "recordsMatched": 0.0,
        "recordsScanned": 0.0,
        "bytesScanned": 0.0
    },
    "status": "Running"
}
Wait a few more seconds, hit the
uparrow in your CloudShell session to bring up the last command, and hitEnter.Sample Results
{ "results": [ [ { "field": "@timestamp", "value": "2022-07-18 12:34:31.195" }, { "field": "@message", "value": "{\"httpMethod\":\"GET\",\"integrationErrorMessage\":\"-\",\"protocol\":\"HTTP/1.1\",\"requestId\":\"Vdn1pgs-oAMEVaA=\",\"requestTime\":\"18/Jul/2022:12:34:31 +0000\",\"resourcePath\":\"-\",\"responseLength\":\"2864\",\"routeKey\":\"ANY /\",\"sourceIp\":\"107.21.85.89\",\"status\":\"200\"}" }, { "field": "@ptr", "value": "CmIKKQolMjA2NzU3ODIwMTUxOi9hd3MvYXBpX2d3L2V2aWRlbmNlX2FwaRAHEjUaGAIGK3IFAgAAAACMcA2dAAYtVTZwAAAEIiABKJuZtoqhMDCbmbaKoTA4AUCYAkjyDFCbBhAAGAE=" } ], [ { "field": "@timestamp", "value": "2022-07-18 12:34:30.964" }, { "field": "@message", "value": "{\"httpMethod\":\"GET\",\"integrationErrorMessage\":\"-\",\"protocol\":\"HTTP/1.1\",\"requestId\":\"Vdn1ng7PIAMEVPw=\",\"requestTime\":\"18/Jul/2022:12:34:30 +0000\",\"resourcePath\":\"-\",\"responseLength\":\"2864\",\"routeKey\":\"ANY /\",\"sourceIp\":\"107.21.85.89\",\"status\":\"200\"}" }, { "field": "@ptr", "value": "CmIKKQolMjA2NzU3ODIwMTUxOi9hd3MvYXBpX2d3L2V2aWRlbmNlX2FwaRACEjUaGAIF9f8OdQAAAAVVXBf2AAYtVTBAAAAHUiABKLuatYqhMDC0l7aKoTA4AkD3BUjCEFDqCRABGAE=" } ], <snip> -
This data looks very similar to if we were to run the
aws logs get-log-eventscommand multiple times against all log streams inside the/aws/api_gw/evidence_apilog group, but CloudWatch Logs Insights allows us to search all log streams at once (and even multiple log groups at once). -
Typically, when fuzzing is performed, many errors may be generated by the application. If you remember, there is a sub-field within the
@messagefield calledintegrationErrorMessage. The following query will output any log entries where theintegrationErrorMessagefield does not equal-when the suspect IP address is behind the submission:QUERY_ID=$(aws logs start-query --start-time $(date -d '-3 hours' "+%s") \ --end-time $(date "+%s") \ --query-string 'fields integrationErrorMessage | filter integrationErrorMessage != "-" and sourceIp == "'$SUSPECT'"' \ --log-group-name /aws/api_gw/evidence_api \ --query 'queryId' --output text) aws logs get-query-results --query-id $QUERY_IDWarning
If you see a message similar to the below message, that means the query is not finished.
{
    "results": [],
    "statistics": {
        "recordsMatched": 0.0,
        "recordsScanned": 0.0,
        "bytesScanned": 0.0
    },
    "status": "Running"
}
Wait a few more seconds, hit the
uparrow in your CloudShell session to bring up the last command, and hitEnter.Sample Results
{ "results": [ [ { "field": "integrationErrorMessage", "value": "The Lambda function returned the following error: An error occurred (ValidationException) when calling the PutItem operation: One or more parameter values were invalid: Aggregated size of all range keys has exceeded the size limit of 1024 bytes. Check your Lambda function code and try again." }, { "field": "@ptr", "value": "CmIKKQolMjA2NzU3ODIwMTUxOi9hd3MvYXBpX2d3L2V2aWRlbmNlX2FwaRACEjUaGAIF9f8OdQAAAAVVXeVqAAYtVTaQAAAHUiABKL3XtYqhMDC17LWKoTA4AkDQBkiKEVCyChABGAE=" } ], [ { "field": "integrationErrorMessage", "value": "The Lambda function returned the following error: An error occurred (ValidationException) when calling the PutItem operation: One or more parameter values are not valid. The AttributeValue for a key attribute cannot contain an empty string value. Key: MD5Sum. Check your Lambda function code and try again." }, { "field": "@ptr", "value": "CmIKKQolMjA2NzU3ODIwMTUxOi9hd3MvYXBpX2d3L2V2aWRlbmNlX2FwaRABEjUaGAIF5f2FfQAAAAUgN99xAAYtVTYQAAAA0iABKMijtYqhMDDQlbaKoTA4AkDgBkijEVDLChAAGAE=" } ], [ { "field": "integrationErrorMessage", "value": "The Lambda function returned the following error: [Errno 2] No such file or directory: '/tmp/<!--#exec%20cmd="/usr/bin/id;-->'. Check your Lambda function code and try again." }, { "field": "@ptr", "value": "CmIKKQolMjA2NzU3ODIwMTUxOi9hd3MvYXBpX2d3L2V2aWRlbmNlX2FwaRABEjUaGAIF5f2FfQAAAAUgNzcmAAYtVS+AAAAA0iABKI6Js4qhMDDrqLWKoTA4BkCwEUisFFDTDRAEGAE=" } ], [ { "field": "integrationErrorMessage", "value": "The Lambda function returned the following error: [Errno 2] No such file or directory: '/tmp/<!--#exec%20cmd="/usr/bin/id;-->'. Check your Lambda function code and try again." }, { "field": "@ptr", "value": "CmIKKQolMjA2NzU3ODIwMTUxOi9hd3MvYXBpX2d3L2V2aWRlbmNlX2FwaRAEEjUaGAIF++x/MgAAAAfmNSfmAAYtVTVQAAABIiABKPeetYqhMDC/rrWKoTA4AkDmBUipEFDRCRAAGAE=" } ], [ { "field": "integrationErrorMessage", "value": "The Lambda function returned the following error: [Errno 2] No such file or directory: '/tmp/<!--#exec%20cmd="/bin/cat%20/etc/shadow"-->'. Check your Lambda function code and try again." }, { "field": "@ptr", "value": "CmIKKQolMjA2NzU3ODIwMTUxOi9hd3MvYXBpX2d3L2V2aWRlbmNlX2FwaRACEjUaGAIF9f8OdQAAAAVVXBf2AAYtVTBAAAAHUiABKLuatYqhMDC0l7aKoTA4AkD3BUjCEFDqCRAAGAE=" } ], [ { "field": "integrationErrorMessage", "value": "The Lambda function returned the following error: [Errno 2] No such file or directory: '/tmp/<!--#exec%20cmd="/bin/cat%20/etc/passwd"-->'. Check your Lambda function code and try again." }, { "field": "@ptr", "value": "CmIKKQolMjA2NzU3ODIwMTUxOi9hd3MvYXBpX2d3L2V2aWRlbmNlX2FwaRABEjUaGAIF5f2FfQAAAAUgNzcmAAYtVS+AAAAA0iABKI6Js4qhMDDrqLWKoTA4BkCwEUisFFDTDRADGAE=" } ], [ { "field": "integrationErrorMessage", "value": "The Lambda function returned the following error: argument should be a bytes-like object or ASCII string, not 'NoneType'. Check your Lambda function code and try again." }, { "field": "@ptr", "value": "CmIKKQolMjA2NzU3ODIwMTUxOi9hd3MvYXBpX2d3L2V2aWRlbmNlX2FwaRABEjUaGAIF5f2FfQAAAAUgNzcmAAYtVS+AAAAA0iABKI6Js4qhMDDrqLWKoTA4BkCwEUisFFDTDRABGAE=" } ], [ { "field": "@ptr", "value": "CmIKKQolMjA2NzU3ODIwMTUxOi9hd3MvYXBpX2d3L2V2aWRlbmNlX2FwaRAAEjUaGAIGK4g4bAAAAABK9+tnAAYtVPFgAAAAwiABKJCf+omhMDCQn/qJoTA4AUCQAUiFB1C0AxAAGAE=" } ] ], "statistics": { "recordsMatched": 8.0, "recordsScanned": 18.0, "bytesScanned": 6420.0 }, "status": "Complete" } -
In the results, you should see a few reasons why the backend Lambda function failed:
- The data being recorded in the DynamoDB backend database table was too large
- A value for one of the DynamoDB keys was invalid
- There is a file referenced by Lambda that cannot be found
- The data being passed to the Lambda function was invalid
-
Use this information to address the next challenge.
Challenge 3: Gather Failed Attack Payloads
Finally, try to acquire some of the attack payloads used by the suspect IP using Logs Insights.
Solution
-
As you discovered in the previous challenge, there were four reasons why the API Gateway requests would fail. One of which was a file referenced by Lambda. A little insight into the Lambda function is that, when the
file_nameandfile_contentis received by the application, the function will create that file in the/tmpdirectory with the same name that was passed via the HTTPPOSTdata and then the hashing will occur before storing the results in the DynamoDB table. -
If the attacker were to be fuzzing the application, they would likely choose one of the two
POSTparameter values since they can directly influence their values. If thefile_nameparameter were manipulated, we would possibly see the parameter value they chose in the error output. -
Craft one more AWS CloudWatch Logs Insights query to extract all of the error messages containing
No such file or directory.QUERY_ID=$(aws logs start-query --start-time $(date -d '-3 hours' "+%s") \ --end-time $(date "+%s") \ --query-string 'fields integrationErrorMessage | filter integrationErrorMessage ~= "No such file or directory" and sourceIp == "'$SUSPECT'"' \ --log-group-name /aws/api_gw/evidence_api \ --query 'queryId' --output text) aws logs get-query-results --query-id $QUERY_IDWarning
If you see a message similar to the below message, that means the query is not finished.
{
    "results": [],
    "statistics": {
        "recordsMatched": 0.0,
        "recordsScanned": 0.0,
        "bytesScanned": 0.0
    },
    "status": "Running"
}
Wait a few more seconds, hit the
uparrow in your CloudShell session to bring up the last command, and hitEnter.Sample Results
{ "results": [ [ { "field": "integrationErrorMessage", "value": "The Lambda function returned the following error: [Errno 2] No such file or directory: '/tmp/<!--#exec%20cmd="/usr/bin/id;-->'. Check your Lambda function code and try again." }, { "field": "@ptr", "value": "CmIKKQolMjA2NzU3ODIwMTUxOi9hd3MvYXBpX2d3L2V2aWRlbmNlX2FwaRABEjUaGAIF5f2FfQAAAAUgNzcmAAYtVS+AAAAA0iABKI6Js4qhMDDrqLWKoTA4BkCwEUisFFDTDRAEGAE=" } ], [ { "field": "integrationErrorMessage", "value": "The Lambda function returned the following error: [Errno 2] No such file or directory: '/tmp/<!--#exec%20cmd="/usr/bin/id;-->'. Check your Lambda function code and try again." }, { "field": "@ptr", "value": "CmIKKQolMjA2NzU3ODIwMTUxOi9hd3MvYXBpX2d3L2V2aWRlbmNlX2FwaRAEEjUaGAIF++x/MgAAAAfmNSfmAAYtVTVQAAABIiABKPeetYqhMDC/rrWKoTA4AkDmBUipEFDRCRAAGAE=" } ], [ { "field": "integrationErrorMessage", "value": "The Lambda function returned the following error: [Errno 2] No such file or directory: '/tmp/<!--#exec%20cmd="/bin/cat%20/etc/shadow"-->'. Check your Lambda function code and try again." }, { "field": "@ptr", "value": "CmIKKQolMjA2NzU3ODIwMTUxOi9hd3MvYXBpX2d3L2V2aWRlbmNlX2FwaRACEjUaGAIF9f8OdQAAAAVVXBf2AAYtVTBAAAAHUiABKLuatYqhMDC0l7aKoTA4AkD3BUjCEFDqCRAAGAE=" } ], [ { "field": "integrationErrorMessage", "value": "The Lambda function returned the following error: [Errno 2] No such file or directory: '/tmp/<!--#exec%20cmd="/bin/cat%20/etc/passwd"-->'. Check your Lambda function code and try again." }, { "field": "@ptr", "value": "CmIKKQolMjA2NzU3ODIwMTUxOi9hd3MvYXBpX2d3L2V2aWRlbmNlX2FwaRABEjUaGAIF5f2FfQAAAAUgNzcmAAYtVS+AAAAA0iABKI6Js4qhMDDrqLWKoTA4BkCwEUisFFDTDRADGAE=" } ] ], "statistics": { "recordsMatched": 4.0, "recordsScanned": 18.0, "bytesScanned": 6420.0 }, "status": "Complete" } -
There is just one more command to clean up the results of the query to extract the possible
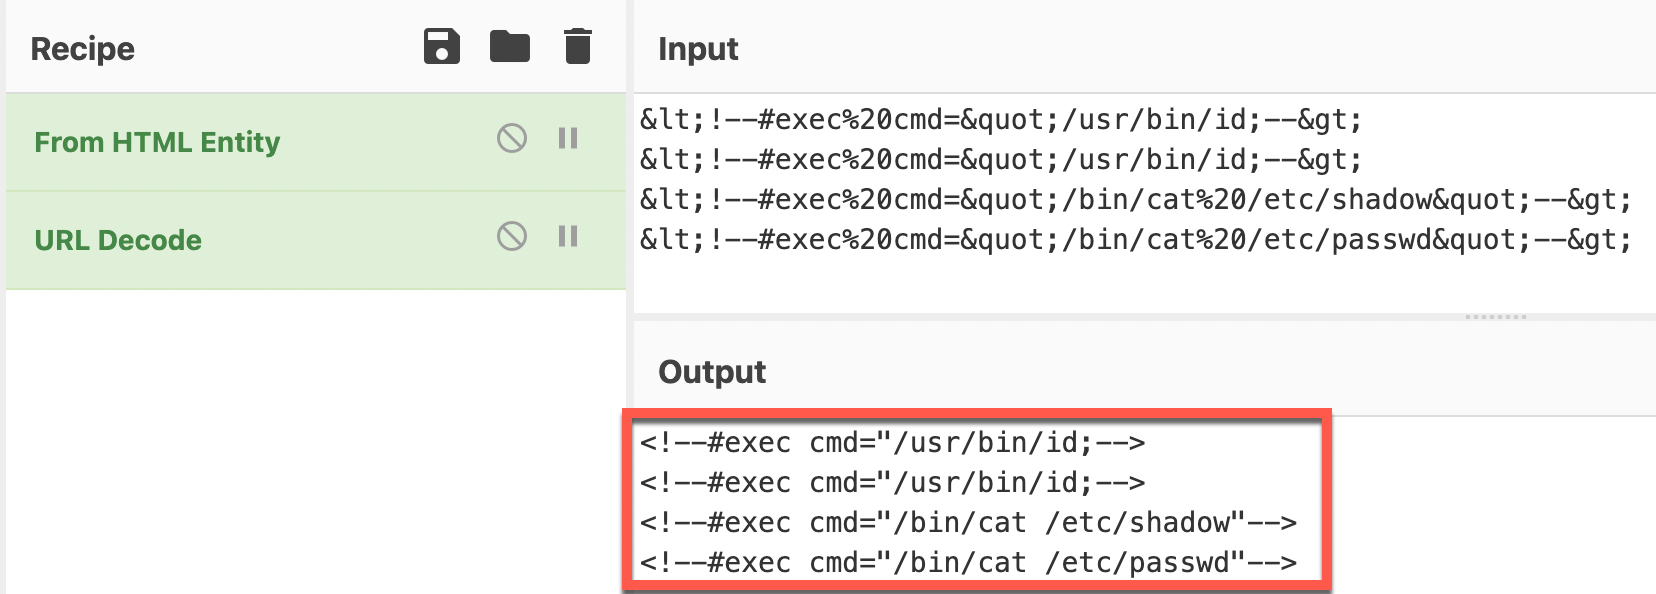
file_nameparameter values that were used in the fuzzing attack. The command below uses the same query output but then post-processes the data withjq,cut, andsedto output just thefile_namevalue submitted by the suspicious actor.aws logs get-query-results --query-id $QUERY_ID | jq -r '.results[][0].value' | cut -d "'" -f2 | sed 's/^\/tmp\///g'Expected Results
<!--#exec%20cmd="/usr/bin/id;--> <!--#exec%20cmd="/usr/bin/id;--> <!--#exec%20cmd="/bin/cat%20/etc/shadow"--> <!--#exec%20cmd="/bin/cat%20/etc/passwd"--> -
Since this output appears to be encoded as HTML entities, we can see what the decoded content would be in this case using a tool like CyberChef.
-
It looks like these attempts were trying to use HTML comments. Keep in mind, these all failed. So which attempt was successful? Unfortunately, the API gateway logs do not give us insight into the successful submissions. Were there any successful submissions by the attacker after these failed attempts? Stay tuned to see if the attacker continued to be active in this cloud account.
ATT&CK
MITRE ATT&CK techniques potentially detected:
| Tactic | Technique | Description |
|---|---|---|
| Initial Access | Exploit Public-Facing Application (T1190) | Found potential fuzzing based upon file_name values |
| Execution | Command and Scripting Interpreter: Unix Shell (T1059.003) | Found remote code execution evidence (but was it successful?) |